YES! you can declare your application resiliency state and keep it like that with the combination of Kubernetes and the new application resiliency capabilities in Tanzu service mesh.
First thing first, what is Tanzu service mesh?
Tanzu service mesh allows you to create and isolate logical structure in Kubernetes cluster or across different clusters to achieve an application layer seven networking and security fabric that you can leverage to add values on top of. Just by connecting the dots, we will get service discovery, observability, security and encrypted connectivity for all object in that global namespace structure. More about TSM global namespaces in these excellent blogs here and here.
In this blog, I focus on a new feature that (in my opinion) is a real game-changer for the way we operate and manage application resiliency. As a background, I used to work on the customer side for most of my technical career in operations and infrastructure roles, and the thing I was mostly concerned about was the application and user experience. We had multiple application monitoring solutions that continuously tested user experience using methods such as synthetic transactions (not real user ones) or tap the transaction to get the live experience. Once we got an alarm that something is wrong with latency and/or experience, we moved to identify root cause in a RCA process (root cause analysis). That time between identification to resolution our application wasn’t being in a healthy manner.
But, what if we could declare our desired (expected as healthy) application behaviour just like we declare a Kubernetes manifest? Not just stating a threshold but declaring a healthy application state which Kubernetes will then enforce? Sounds like science fiction? Well, it’s not, cause that’s exactly what we will soon deliver with the combination of Kubernetes and Tanzu Service Mesh new feature of application SLO’s and application autoscaling.
With Tanzu Service Mesh declarative SLO’s you can configure a definition of user experience SLI’s like p50, p90, p99 latency (p50=50% of transactions, p90=90% etc.) or performance metrics like CPU consumption, request per second and more. With that configuration, you can now get notified when that SLO is being violated and understand the health state according to that. The really cool science-fiction part is where you can act on that definition using a distributed autoscaler to auto-scale your application deployment and bring you back to your intended state or SLO. That SLO definition of the application is declared in the Kubernetes clusters that are part of the Global Namespace in TSM with a new custom resource definition (CRD) autoscaling.tsm.tanzu.vmware.com.
you can read more about that feature and capabilities in the next blog
Now for a demo
The following demo is based on the ACME application, which is a polyglot application built in a microservices architecture. I’m using this same application across all my TSM demos because its easy to slice the components and get visibility.
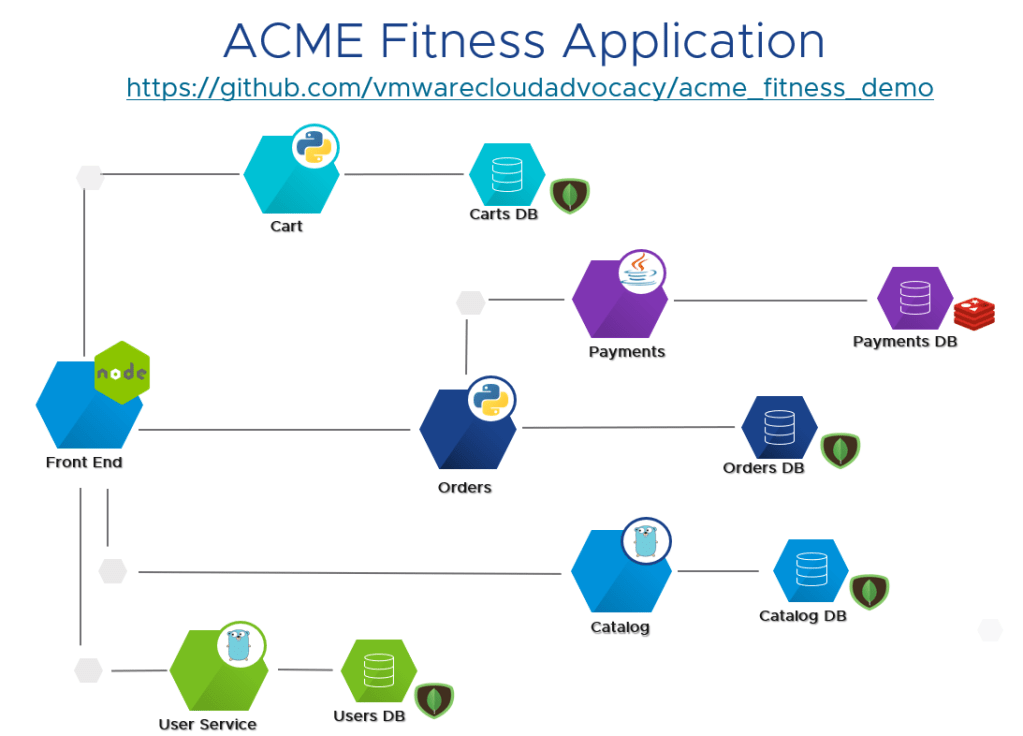
In this demo, I’m distributing the services in multiple clusters, where the Acme frontend service in Kubernetes is called “shopping” and all the backend services run on a separate cluster. When you connect those objects under the same global namespace, you will have a service discovery map. This can work not only across clusters in the same site, but also across clouds, check out the following blog about how far you can take this. The screenshot below is from my GNS:
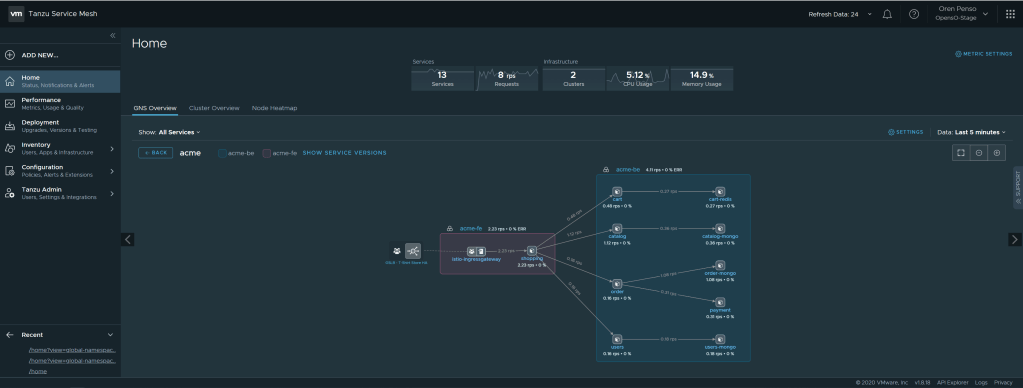
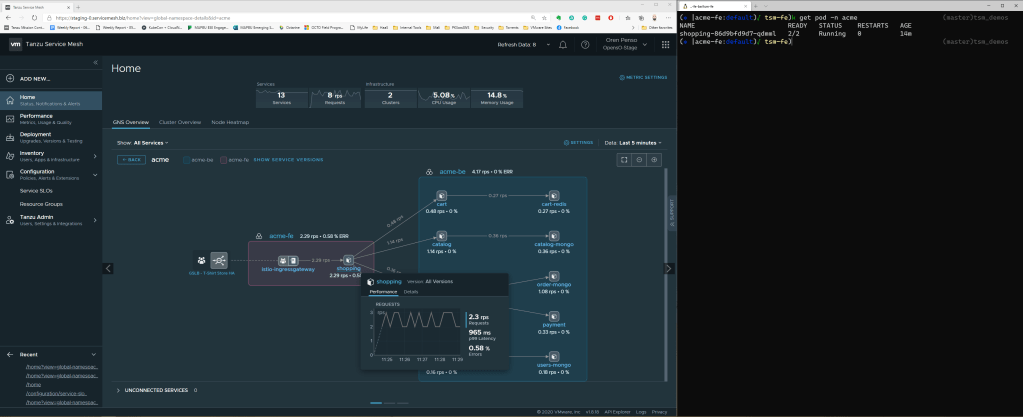
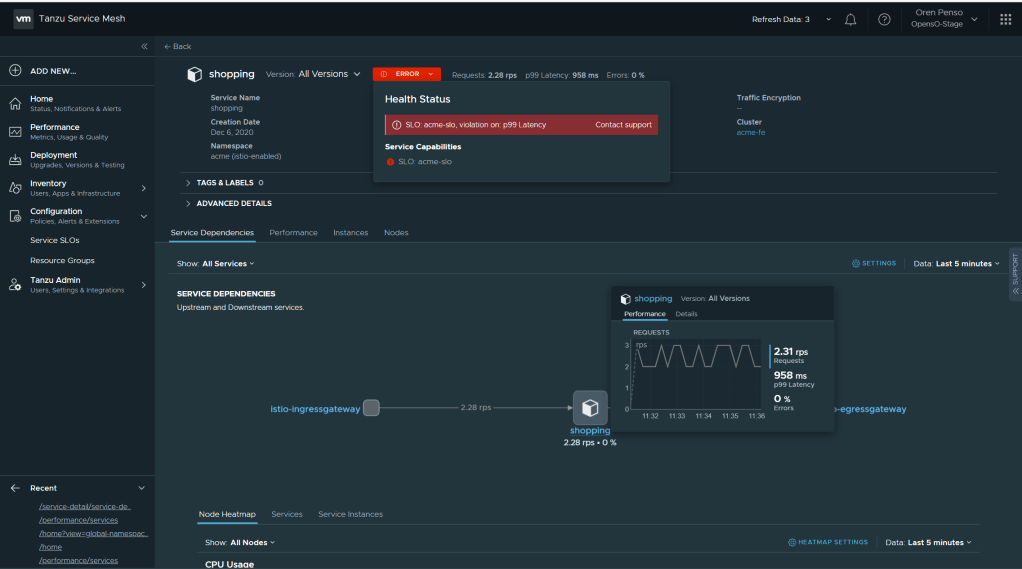
In this topology map we can see the connectivity between the frontend and all of the services in the back end. Now, I will create an SLO definition for my frontend that will enforce my desired user experience. By hovering above the service itself, you can see the current p99 latency ~960ms. I will now create an SLO definition that will alert me that the latency went above 500ms so basically we are simulating an Error in the SLO policy
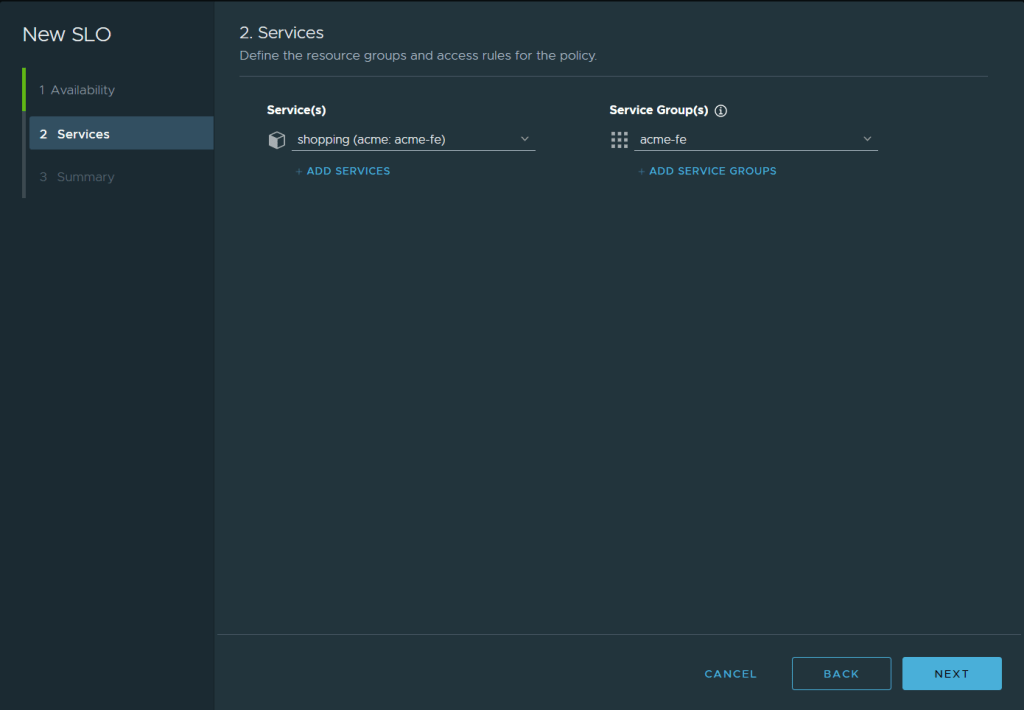
The configuration of the SLO definition will be that the p99 < 500ms and the percentage of the time to meet that this. In my case to simulate an error I’m configuring 100% of the time. So the app p99 latency should stay under 500ms all the time.
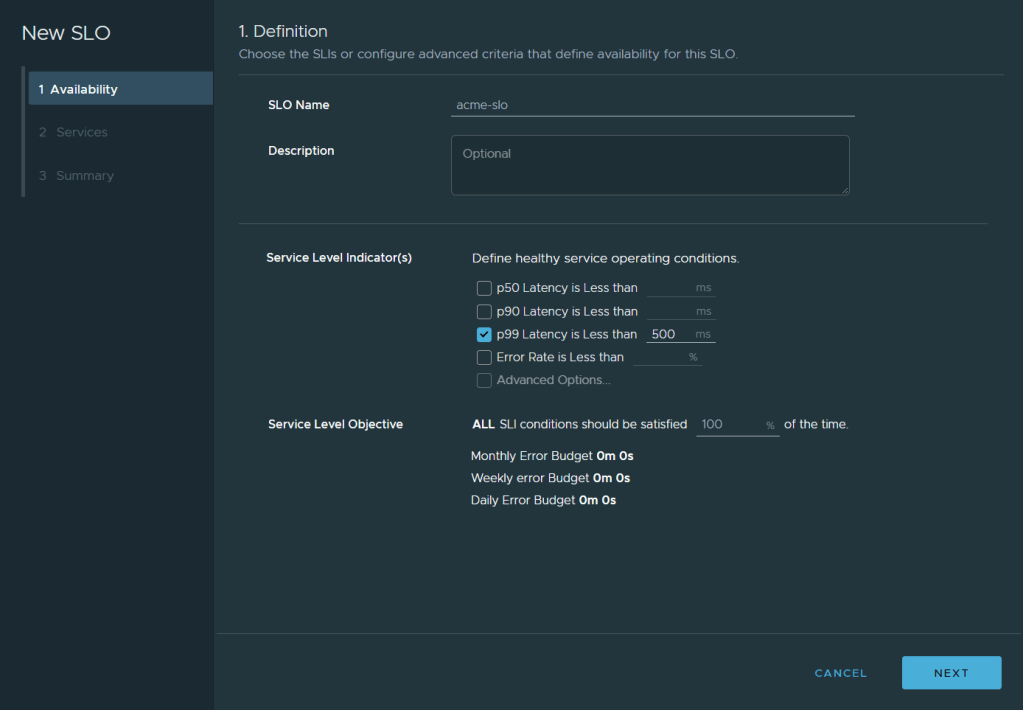
The services I am applying the SLO policy to is just the frontend one called “shopping”
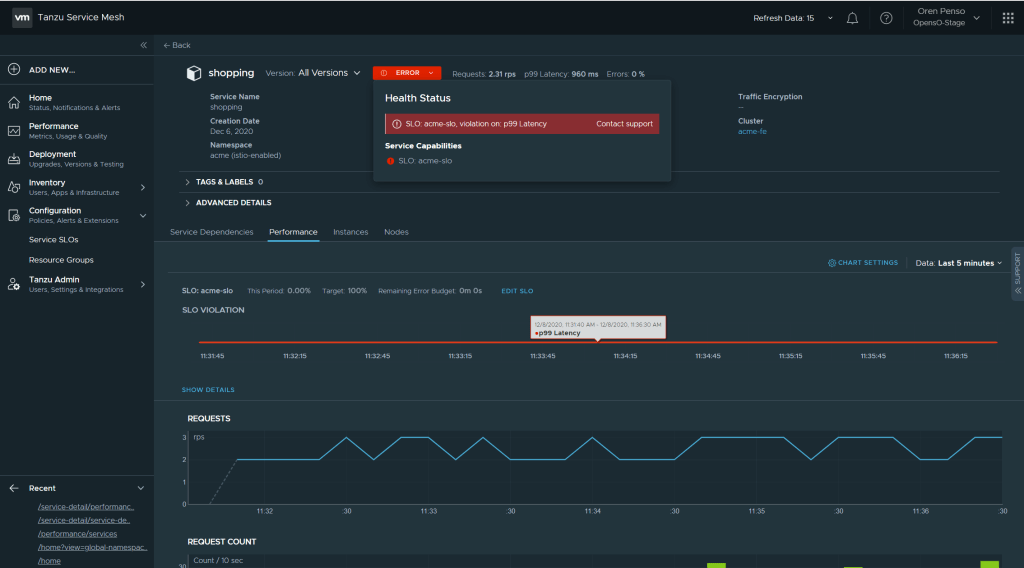
By Applying that policy I can immediately see the error and violation of the policy in the performance page of the “shopping” service
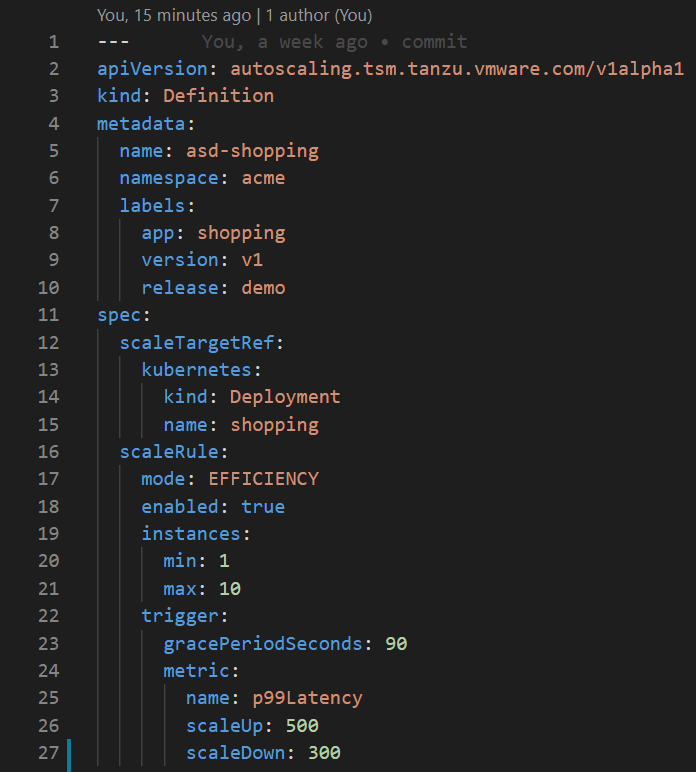
I have applied on the kubernetes side my declarative state for autoscaling my application in this case I’m stating that the deployment can scale up to 10 replicas if the threshold of p99>500ms is met. and it will scale back down when the threshold will be p99<300ms.
Now on the Kubernetes side I can see that the deployment is being scaled out automatically to meet the demand of the threshold and bring me back to the intended state.
you can see that on the kubernetes side
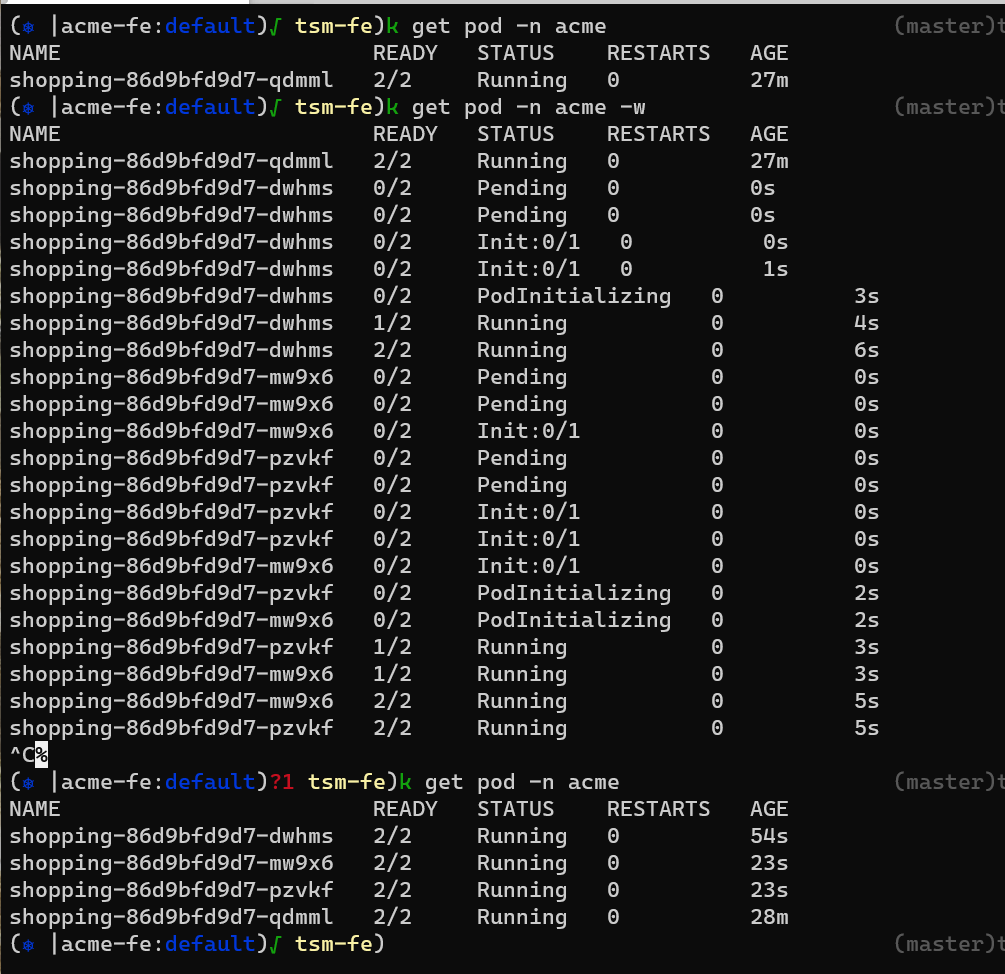
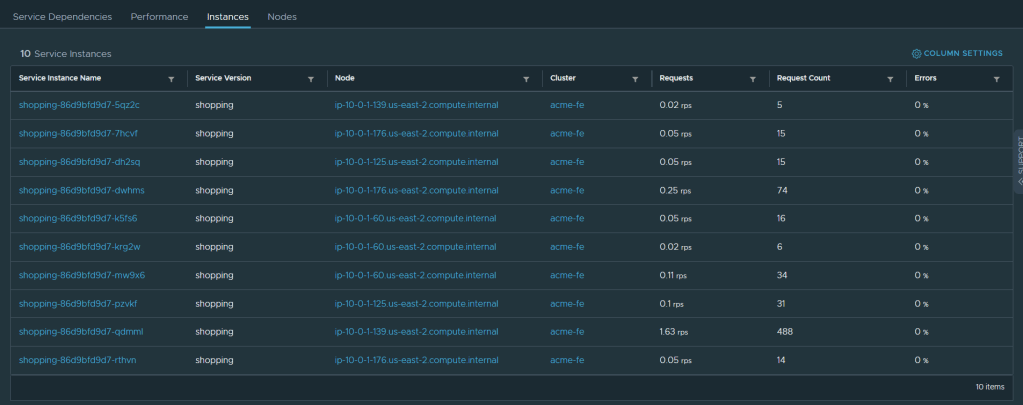
once the auto-scaler kicked in the pods were created in the FE cluster. you can also see that on the Tanzu Service Mesh console in the Instances pane
When the application latency will go down, the intelligent auto-scaler will scale down and will always make sure it keeps the intended state you declared in the SLO policy. This can be also based on CPU and memory, not only latency and we ill add more SLOs as the platform evolves.
This is a game changer in the way we use policies and declarative infrastructure in a multi-cloud/multi-cluster distributed manner to keep our intended state not just in the infrastructure side but now also in the application side. And we are only starting. stay tuned! 🙂
