From the project’s Github page: “Octant is a tool for developers to understand how applications run on a Kubernetes cluster. It aims to be part of the developer’s toolkit for gaining insight and approaching complexity found in Kubernetes. Octant offers a combination of introspective tooling, cluster navigation, and object management along with a plugin system to further extend its capabilities”
In all my years of experience consulting to customers on Kubernetes there was one thing that customers have always asked for “Its all very cool but, where is the UI?”
There was an assumption for some time that because Kubernetes and the landscape around it is more focused on the DevOps community which use API/CLI mostly, that customers don’t need a Kubernetes UI and that all configuration is orchestrated and that the tools customers use will be monitored by the common open source observability projects out there and we are good.
But, the fact is, people need a UI! In general humens understand things better with visualization, which makes it easier to understand what’s going on within our Kubernetes. This is true especially when we start extending the platform with CRD’s (custom resource definition) and use open source projects across clusters with projects like, Helm, Velero, Knative, Jenkinsx, Spinnaker, CloudNativeBuildpacks and more.
Octant work in a very simple way. All you need to do is load your Kubeconfig file and get visibility to all of the Kubernetes clusters you manage. In addition Octant will allow you to make changes, such as edit Kubernetes objects in your clusters and connect to the pods console shell through the Octant web interface.
As an extensible open source project with large community, Octant can be extended with several plugins to get visibility to other aspect of the clusters like Helm plugin, Antrea plugin, Velero plugin and even JenkinsX announced that Octant will be the UI for the product.
Installation is quite easy. All you need to do is download the binaries and run it on a Linux / Windows / MAC machine with a config file configured under .kube folder, other ways exists, follow the installation instructions to learn more.
Lets take a closer look on the installation and configuration.
In my environment, I am running Octant on an Ubuntu Linux server and use Putty to connect to it over an SSL Tunnel.
Download the Octant binary from the release page
Extract the tarball or zip where X.Y is the release version:
$ tar -xzvf ~/Downloads/octant_0.X.Y_Linux-64bit.tar.gz
octant_0.X.Y_Linux-64bit/README.md
octant_0.X.Y_Linux-64bit/octant
Verify the version and move it to a folder that is in your path
$ ./octant_0.X.Y_Linux-64bit/octant version
$ mv ./octant_0.X.Y_Linux-64bit/octant /usr/bin/octant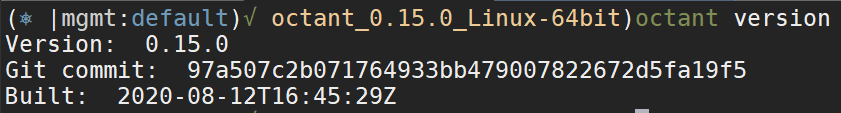
make sure that your kubeconfig is setup with the clusters you want to manage with Octant (you need to have access to at least one healthy Kubernetes cluster)
To verify your configured Kuberentes clusters run in each one:
$ kubectl cluster-info
At this point run the Octant binary on the local Linux machine, it will load the default Kubeconfig file from the .kube folder under the user
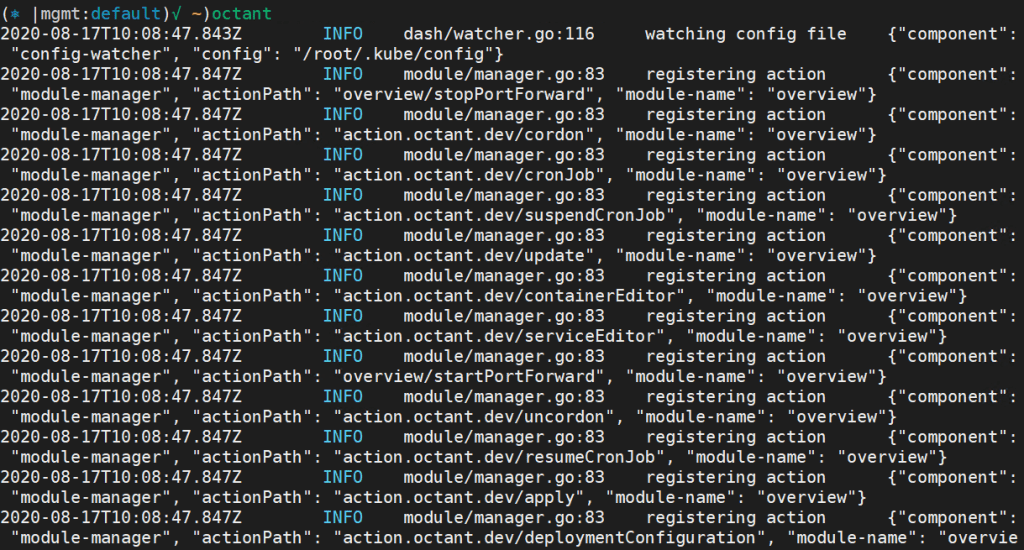
and will start a web service on port 7777 by default

if you are running this on a MAC or Windows WSl which have a local browser, skip the next step and open the browser locally pointing to the local web service Octant created. If Octant is running a machine that doesn’t have a web browser you will need to open a tunnel to it. In this example I am using Putty which allows you to create such SSH tunnel which will allow you to open your browser with the Octant dashboard.
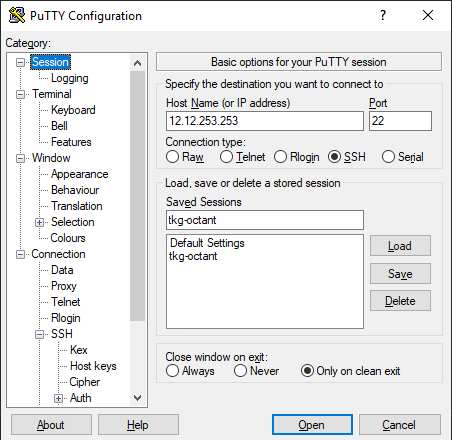
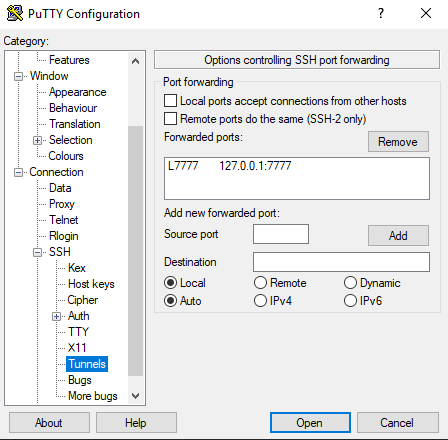
Start the SSH session to the Linux machine, enter the user and password and connect to the ssh session. While the session is running you can browse the localhost IP http://127.0.0.1:7777
That’s it! Octant is running and fully operational!
Now, let’s go over some key functionalities of the dashboard.
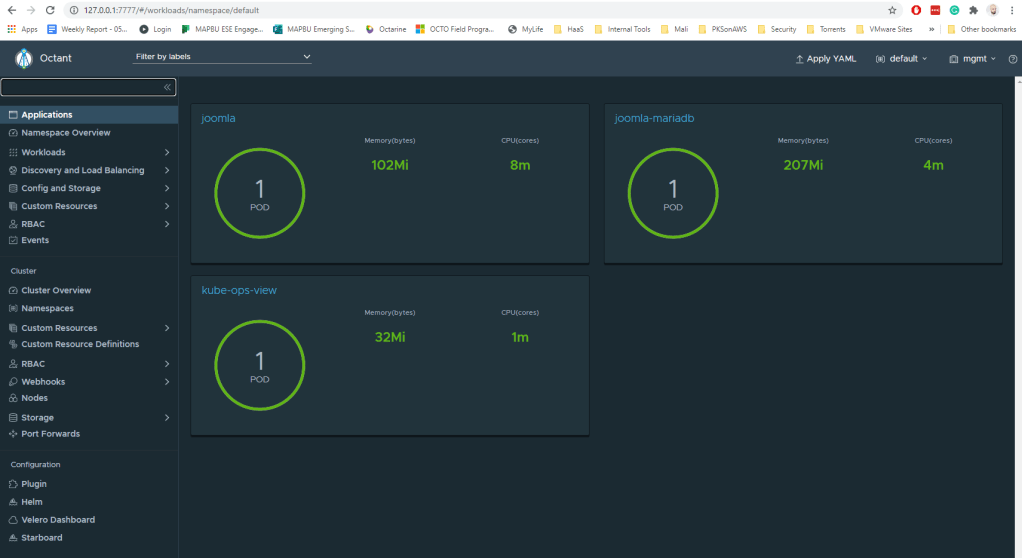
The Dashboard
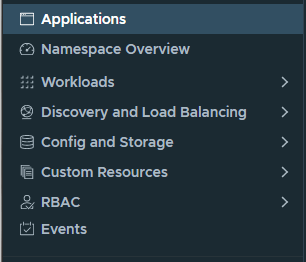
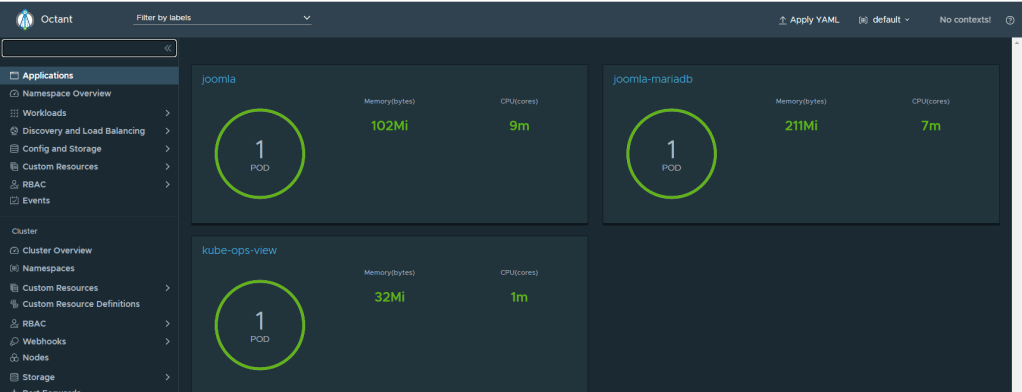
The dashboard is divided to the types of objects Kubernetes manages. In Kubernetes you have objects on the namespace level and on the cluster level which are represented in the top pane (namespace) and the bottom pane (Cluster) .
In the upper group of the properties that is dedicated to the namespace objects we see the application side of things. All of the objects that will be created in a namespace will be here to see and manage, for example when applying a new YAML file it will show up on a namespace level.
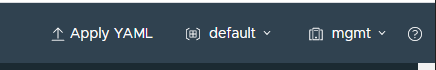
In the example below the cluster is Mgmt and the namespace is Default
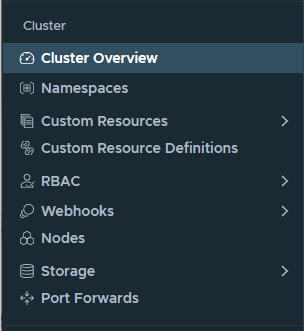
The lower group is dedicated to cluster level objects that will affect the entire cluster.
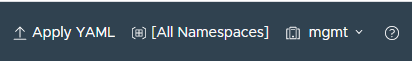
When in namespace view, you can switch namespaces in the top right corner of the screen.
note – when in cluster view you won’t have specific namespaces specified because all the objects are in a cluster level
Plugins
Octant has highly extensible plugin system for users to provide additional functionality through gRPC. Plugin authors can add components on top of existing views.
Find out more about plugins here.
here are some plugins that I am working with:
- Octant-Velero plugin – view the velero backup and restore objects (Velero is managed in my environment by Tanzu Mission Control)
- Octant-Helm plugin – view all the Helm packages that are installed in the cluster you manage
- Octant-Antrea plugin – manage the Antrea CNI objects, the controller and agents and trace flows
- Aqua-Starboard plugin – view security aspects of the cluster and application like vulnerability assessment and security configuration
Installing a plugin is as simple as dropping the plugin file in the .config/octant/plugins path and stop start Octant binary again.
Application management
lets go over some key capabilities on application management:
- Apply yaml files – when you choose the cluster and namespace in the upper right corner you can apply a yaml file directly from the dashboard
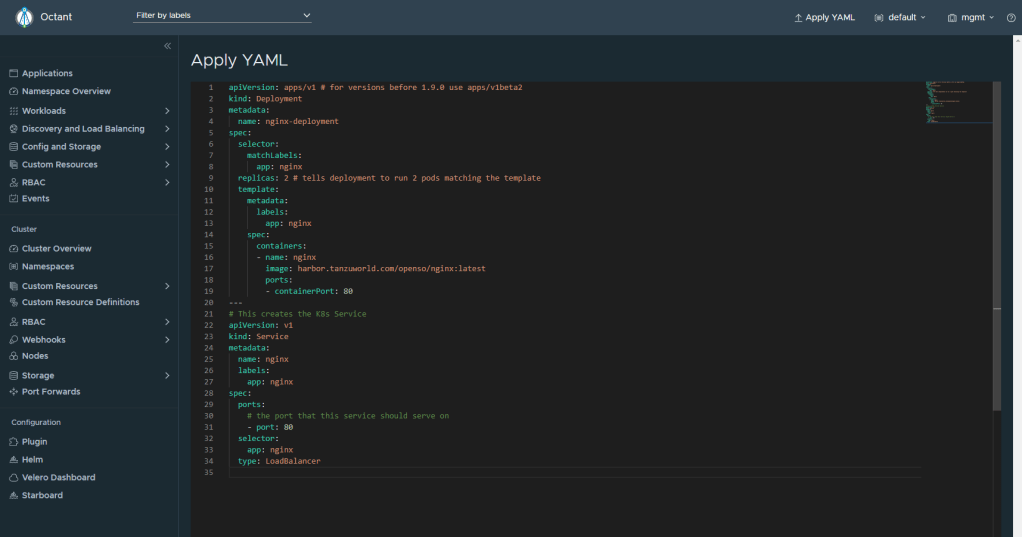
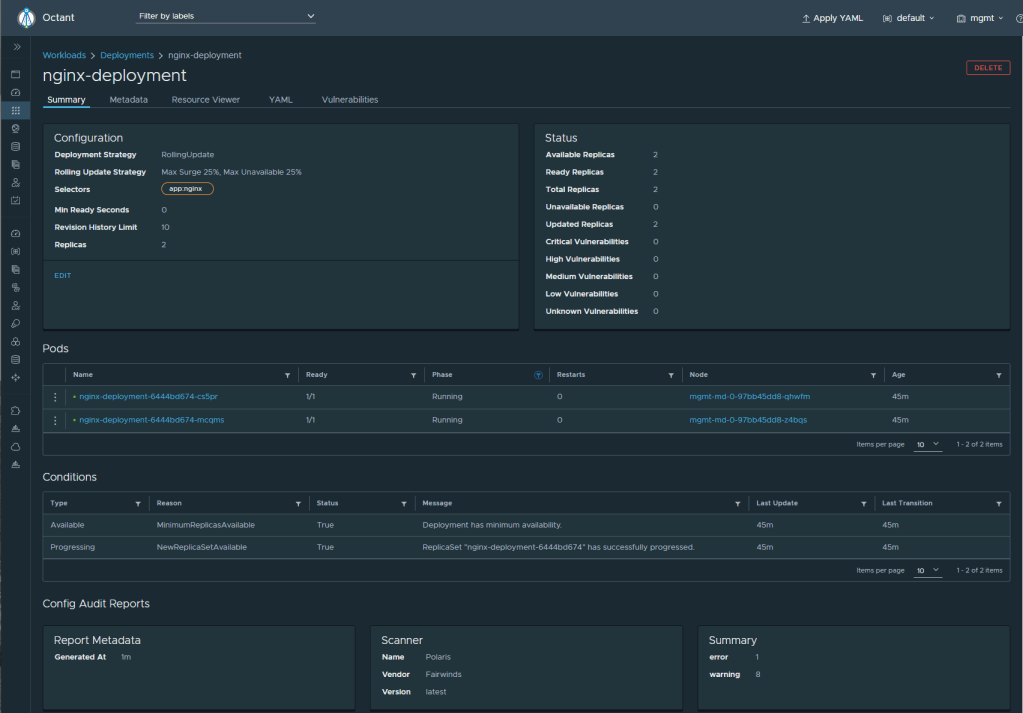
By applying the yaml file a deployment object is created and the pod’s will be schedule on the nodes (Nginx demo app in our case)
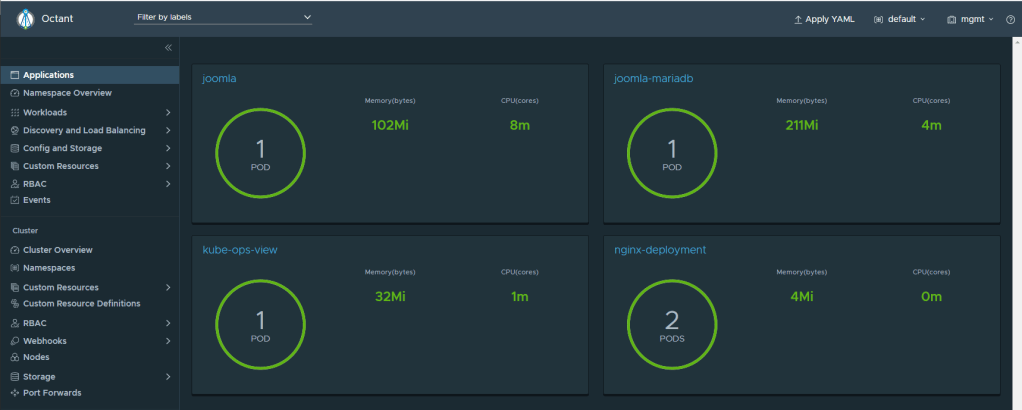
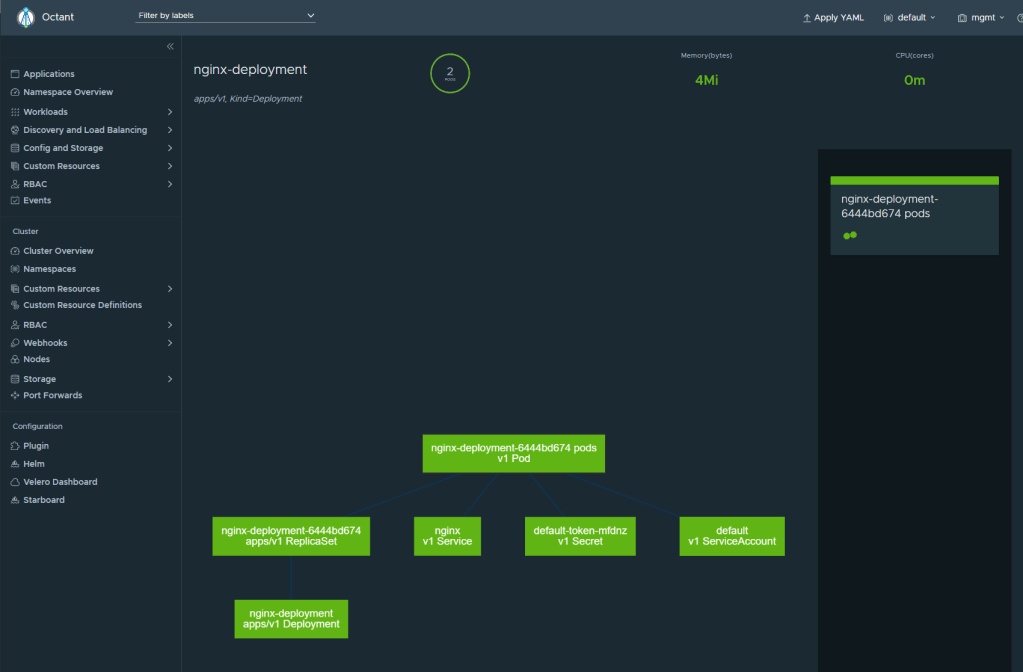
clicking on the application will lead to more info about the app and all the objects that is related to that app
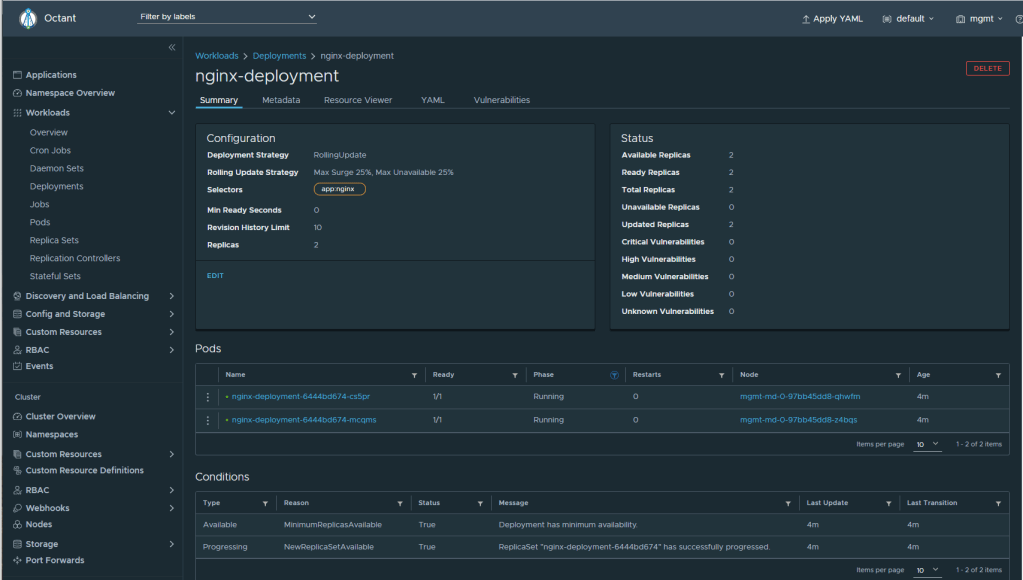
you can also change the deployment by changing the object in the dashboard
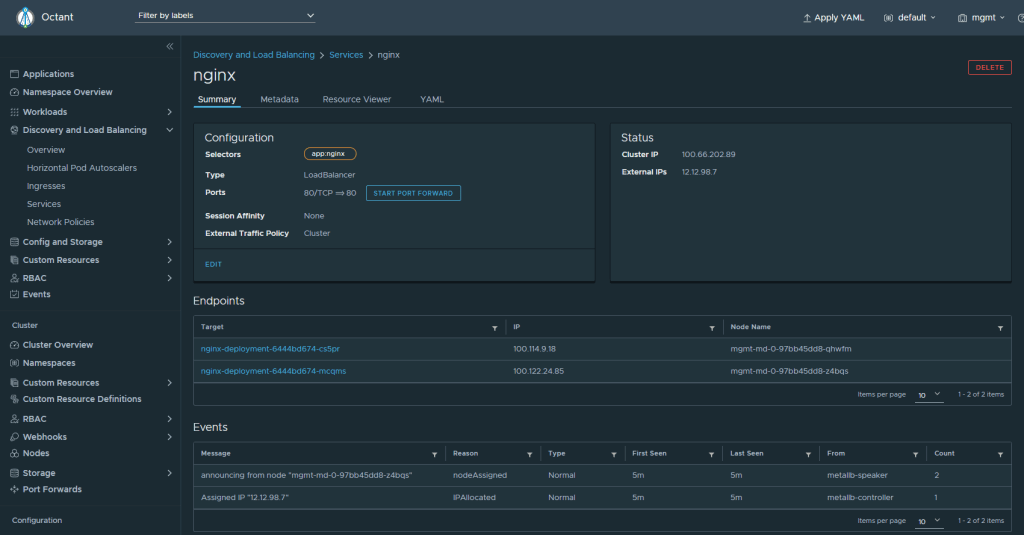
Check or change the service in the services view and get the external IP to browse it
Horizontal POD Autoscaler
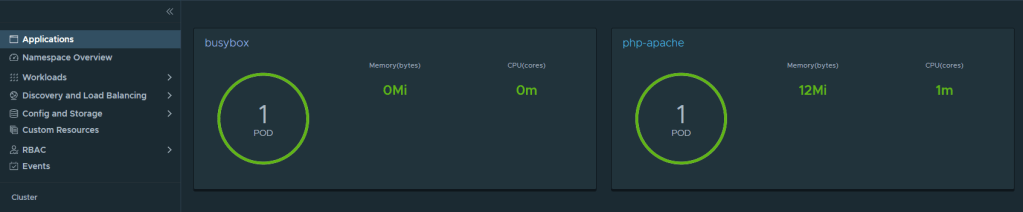
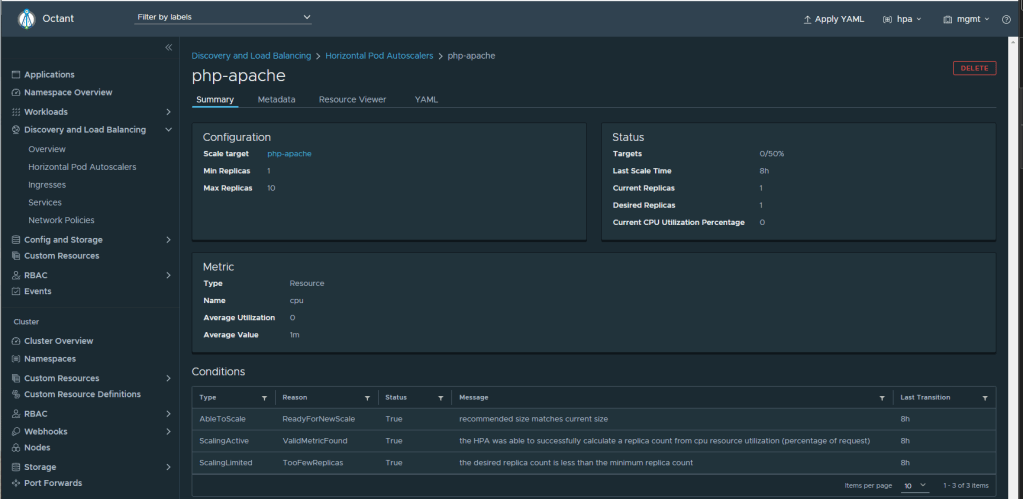
We can see info of Kubernetes HPA (Horizontal POD Autoscaler) if t is configured . To get the application CPU and Memory resource consumption install the kubernetes metrics server and the restart Octant, without it we cannot configure HPA. once the metrics server is deployed we see the consumption rate of the application
you can configure HPA and mange the object in the Discovery and Load Balancing tab. Follow the guide here
Lets check the HPA capabilities. to do so we need to load the PHP demo app, for that I deployed the busybox pod in the same namespace. We can get open the shell of the pod inside Octant dashboard in the POD view, the equivalent to running ‘kubectl exec’ (which is very cool)
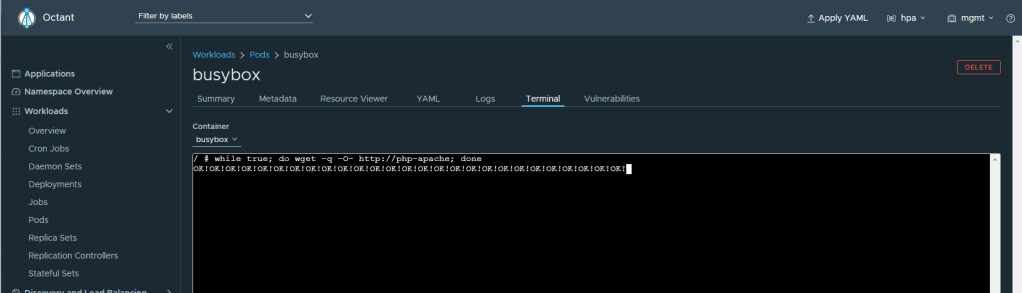
After a minute or so the object will show the load in Octant, you can see the replicas scaled to 5
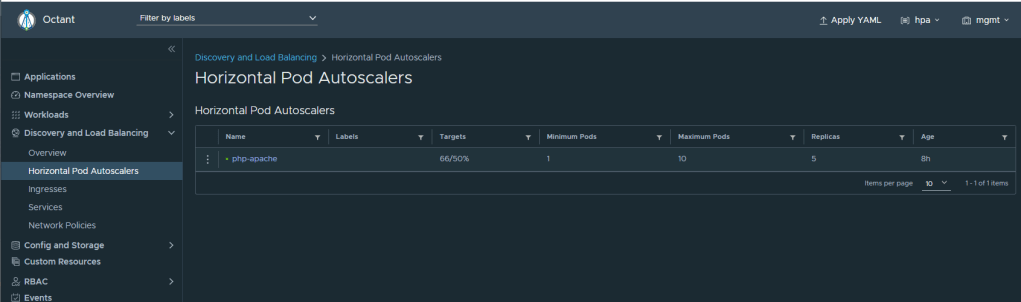
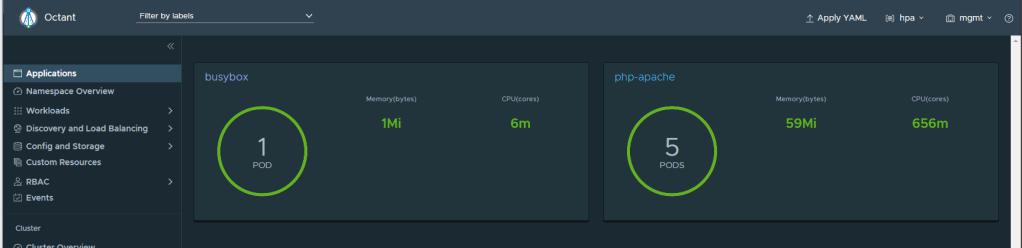
stopping the command in the busybox will revert the object and scale to 1
CRD’s (Costume resource definitions)
We can manage CRD’s in a namespace, for example Istio service mesh, or policies that will apply on a NS level. In the example below i am managing VMware Tanzu Service Mesh objects on a Tanzu Kubernetes Grid Cluster directly from the Octant dashboard
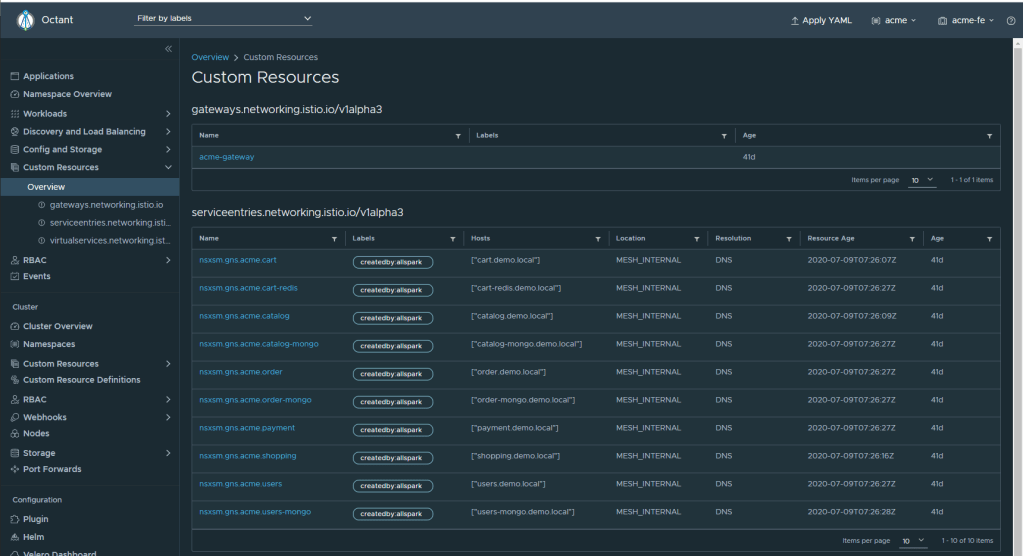
you can see all the information about the mesh, such as the mesh gateway object and service entries to manage global name space objects across multi cluster multi cloud environment. you can read more about GNS in this wonderful blog from Niran
Cluster Management
In the cluster level we can manage the nodes, namespaces, resources, CRD’s and other cluster level objects. In the example below i’m managing a vSphere cluster that has a Tanzu supervisor cluster. This mean that i’m running Kubernetes the control plane for my vSphere environment
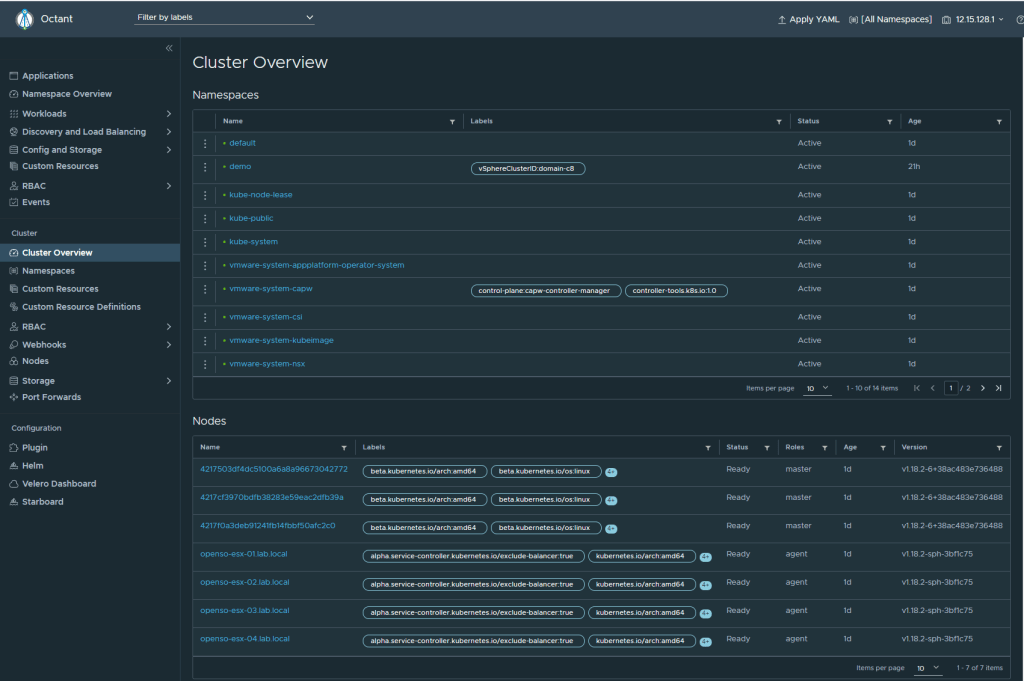
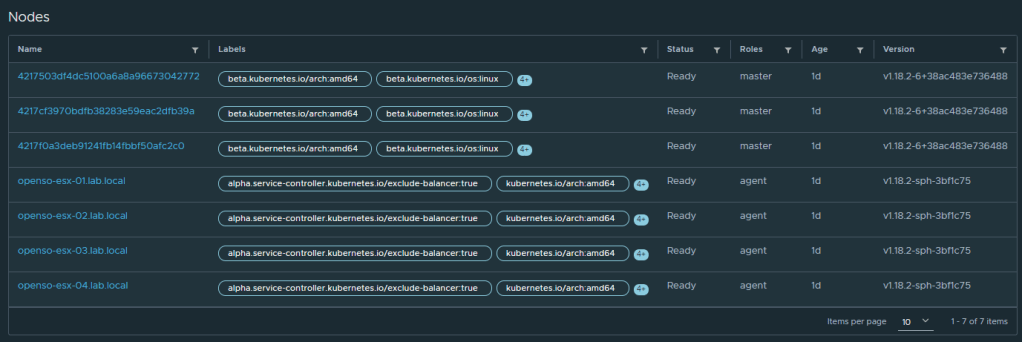
you can see that the Kubernetes nodes are the ESXi servers themselves
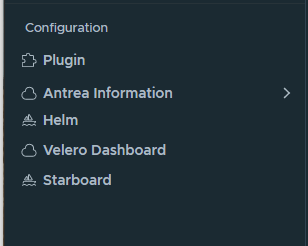
Plugins
lets go over some plugins visibility
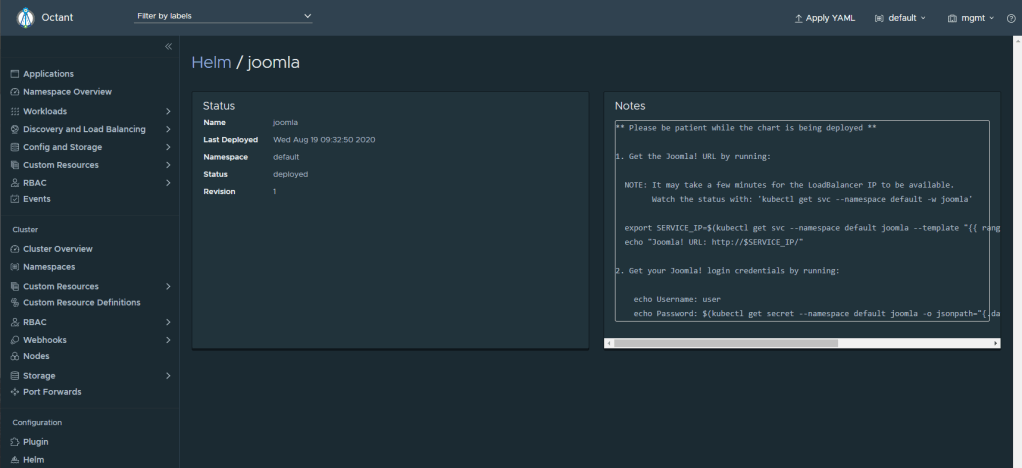
- The Helm plugin will show you the helm packages installed in the cluster
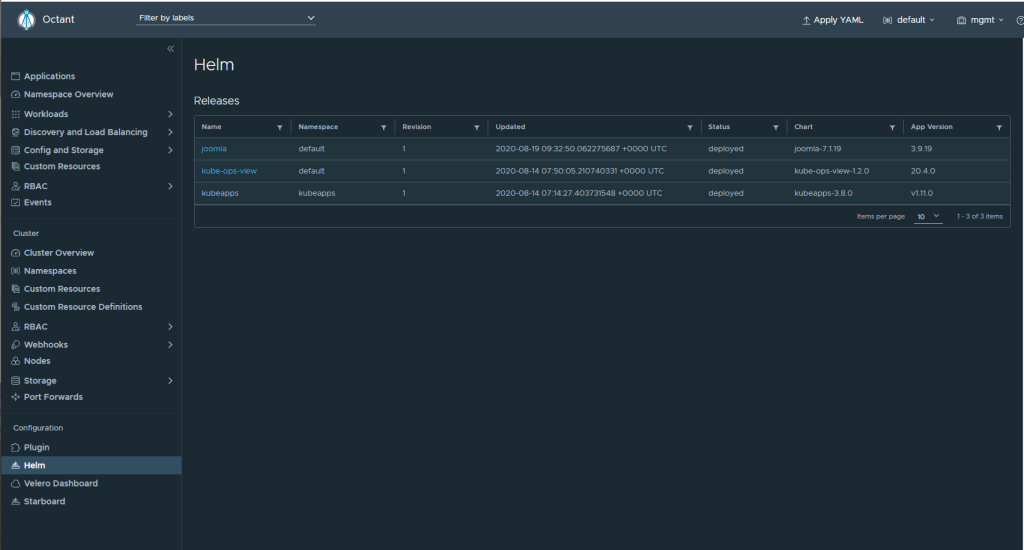
Clicking one of them will lead to the helm installation instructions page
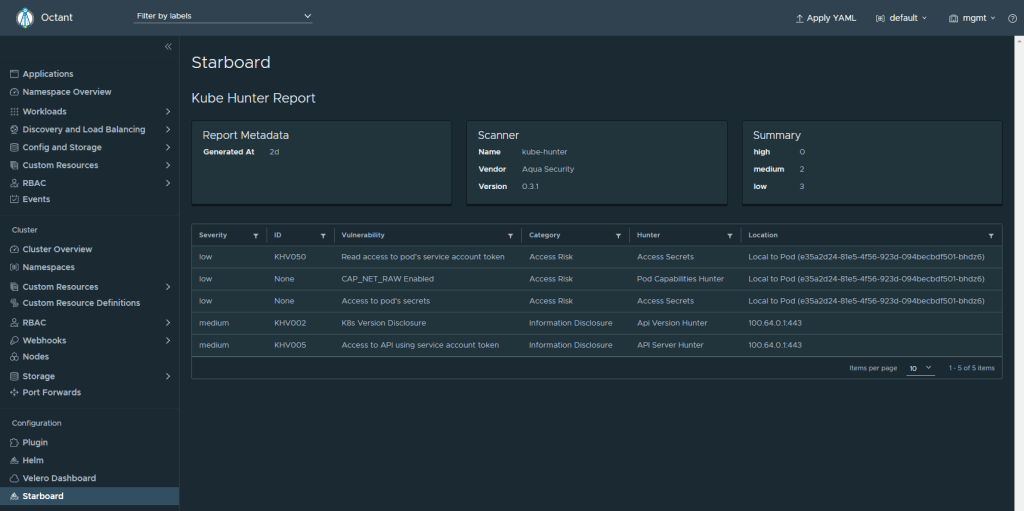
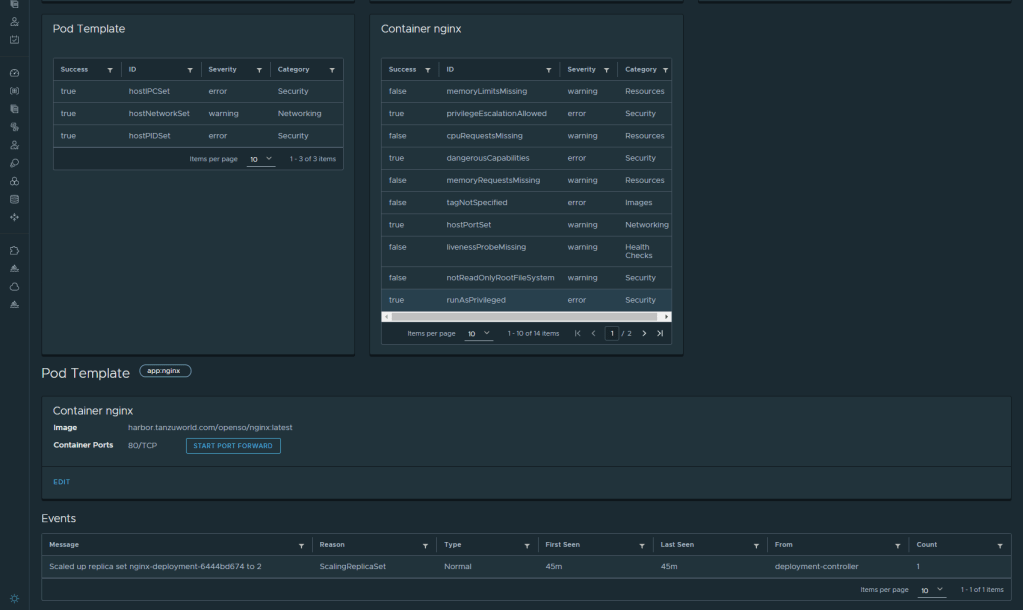
2. Starboard will give you visibility of the security aspects of the cluster. vulnerability scanning, CIS benchmark check and configuration best practices check
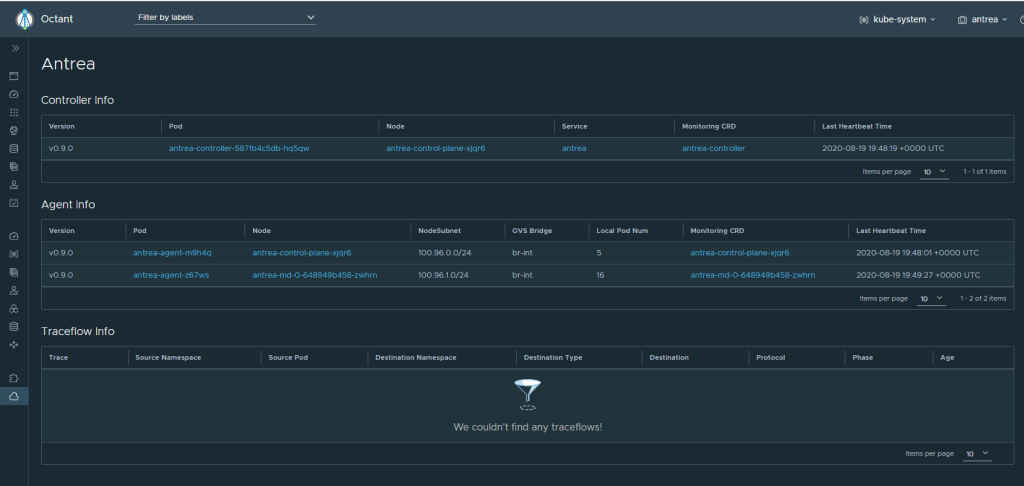
3. Antrea Plugin
Antrea is an open source CNI for kubernetes clusters contributed fully by VMware to the community. you can read more about project Antrea here
The Octant Antrea plugin will allow you to see and manage Antrea objects and traceflows which is very cool but on that in another blog post 🙂
Pheww, that was a lot of information. Please let me know if you find it useful or not and any comments are welcome.
Until another time my freinds
cheers,
Oren

Hello mate ggreat blog post
LikeLike