Authored by:
Oren Penso (Twitter: @openso)
Roie Ben-haim (Twitter: @roie9876)
In our recent internal discussions regarding cloud-native applications and how microservices add value by evolving applications architecture, we were also exploring the challenges that this change brings to the table.
In this blog post, we will try to address these questions and explore more around the subject.
Application Architecture is Changing
Application Architectures are ever changing. Over the past several years, the application space has evolved from monolithic to microservices architecture, though the monolithic application is still the majority of apps out there the adoption of microservices architecture is fast growing.

This change is driven by the need for speed. companies are under constant pressure to innovate faster and provide business value to be able to compete in a very competitive market. Some call this “Digital transformation” and no market vertical is exempt from taking this transformation.
Most of this innovation is done in software, and enterprise businesses hire a growing number of developers to transform innovative ideas into a reality.
From a software development point of view, in a monolithic app, all components that compile the application are packaged and tested as a single unit. If for example, the UI team needs to make a small change in the code, that small change can have a ripple effect where the entire application stack would need to be redeployed.
In a microservices architecture, the application functionality is broken into smaller pieces. Now, each part of the code is running independently from other pieces and may even be developed by separate teams and in multiple languages. These microservices communicate with each other using a language-agnostic APIs (e.g. REST).
The host that runs a microservice can be a VM, but containers have evolved as the preferred packaging unit for microservices due to their small footprint, quick startup times and easy creation process. Combining the concepts of microservices with the benefits of containers enables companies to easily deploy, upgrade, patch and decommission parts of their application quickly and independently.

The change to microservices is affecting not only the technology stack but provide real benefit to the organizational and cultural aspects of the business. You can read more in this excellent blog from our colleague Oded Shopen:
https://medium.com/@odedia/microservices-are-for-humans-not-machines-721a6a56344f
Great innovation requires great responsibility
While the change from monolithic apps development to microservices architecture bring significant value in terms of agility and speed, it also introduces a new complexity.

http://blog.camunda.com/post/2018/09/microservices-orchestration-survey-results-2018/
As you can see from the survey above, there are several challenges regarding the behavior of microservices and the implementation of the architecture in a production environment.
Most of the challenges stem from the fundamental change to a distributed architecture where your code is now spread over the multiple processes.
Service mesh and the ecosystem around it provides an answer for some of these major challenges.
The answer is Service mesh
A Service mesh (SM) is an abstraction layer for the network in a microservices architecture.
In his blog post, Niran Even Chen compared the service mesh to some kind of virtualization and by that helped to better understand the value:
http://cloud-abstract.com/service-mesh-is-just-another-form-of-virtualization/
The abstraction “magic” of the service mesh is realized through its data plane component called the proxy. The proxy runs as a container inside the K8S Pod (referred to also as a “Sidecar”). All communication in and out of the Pod is done through the service mesh’s proxy, and therefore control of the Pod’s communication is delegated to the proxy.
In the picture below, we can see an example of a service running within a Pod and SM (Service mesh) Proxy sharing a Pod, any traffic directed or originated by service A will go through the SM proxy.

When we expand the mesh with additional services, every service will have a proxy inside the same Pod. All “service to service” communication passes through the proxy, so the entire traffic is managed by the service mesh.
In the image below, service A communicates with service B via a proxy.

As mentioned before, the traffic flows between the proxies, that’s the data plane traffic of SM.
The leading open source project for SM proxy is Envoy.
Envoy: https://www.envoyproxy.io/
Envoy is a CNCF mature project by itself and is used in solutions like Istio but also PCF and many other solutions who make use of Envoy.
The proxy provides many features:
- Dynamic service discovery
- Layer 7 Load balancing
- TLS termination
- HTTP/2 and gRPC proxies
- Circuit breakers
- Health checks
- Staged rollouts with %-based traffic split
- Fault injection
- Rich metrics
The question now is, where is the policy that controls the proxy’s behavior created and implemented?
Service mesh Control Plane
The Service mesh control plane core components are:
- Config (Pilot in Istio)
- Policy (Mixer in Istio)
- Certs (Citadel in Istio)
In the following diagram, we can see the separation of the control plane from the data plane.
Config
The config component is responsible for the configuration of traffic rules in the proxy, the config converts the policy created by the DevOps team to traffic rules. The config component is also responsible for service discovery in the mesh (detected by the proxy)
Policy
The policy component enforces access control and usage across the Service mesh, it’s also responsible for collecting telemetry data from the proxy.
Certs
The cert component (Certificate authority server) generates certificates for each proxy in the mesh, by providing certificates to the proxies in the mesh we can encrypt the “service to service” traffic. Another key functionality of certs is user authentication mechanism.

Connecting the dots of microservices – Application Resiliency
In a monolithic architecture, communications between different methods\functions\processes happen in the same server as in-memory calls. The move to microservices architecture replaced the in-memory calls with network calls.

This change brings new challenges related the communication between microservices. Developers in a monolithic architecture do not need to deal with latency between two processes running on the same server, but with microservices, network latency becomes a concern. High latency can now cause failure in a service response. Scenarios such as timeouts between microservices, circuit breakers or fault response needs to be handled in code at the application layer, or at the platform level. For the application stack, we can achieve it using frameworks such as https://netflix.github.io/
Some of the Netflix OSS services are described in the following list:
- Hystrix: Latency and fault tolerance library.
- Zuul: Edge service that provides dynamic routing, monitoring, resiliency, security
- Ribbon: Client-side load Balancing
- Eureka: Service discovery

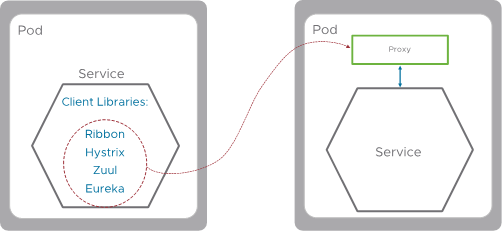
Keep in mind that the answer here isn’t the same for all languages. The client library depends on the language the code it is written in. For example, Netflix OSS and Spring Cloud are designed specifically for Java. If your application is written in Python you will need a different solution.
Application Resiliency with Service mesh
The microservice architecture does not solve the challenge of application resiliency, it amplifies the challenge because now the developer is supposed to solve it with logic in each microservice independently.
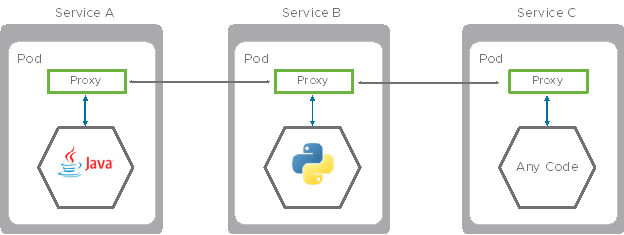
In the picture below, we see three microservices. Two microservices are running a java application so for that, we can apply the Netflix OSS as their client libraries but the third microservice runs a python application. Which client libraries can we run there?

To make things more complicated, microservices by definition are polyglot, meaning each microservice can be written in a different language. We need to solve the resiliency challenge for each coding language with its own frameworks/libraries, which adds to the inconsistency in the development process. So microservices may result in more languages to support, and more services to monitor.
Service mesh enables us to offload application resiliency functionality from the code to the SM data plane (proxy). The implementation of the resiliency can be done in the proxy to untangle the dependency from the coding language running at the microservice container itself. Since the proxy runs as a separate container (sidecar) inside the Pod, it is agnostic to other containers running in the same Pod.
The implementation of the resiliency inside the proxy is not Netflix OSS but the functionality is similar.
When we move the service resiliency functionality to the proxy we decouple it from the coding language, as you can see this allows us to run python application in service B and Service C with different code languages, that’s one of the key values of the SM proxy.
Traffic management
To better understand the value of SM for traffic management we will review the effort needed to create and push a new version of an application to production.
In a monolithic architecture, it’s relatively easy to address a single application since it’s a single stack, all we need to do is re-build the entire stack’s components and deploy it with the new version. The downside is that it is also true if we need to make a small change in our code. We will still need to test and push a huge monolithic block.
The image shown below describes the single monolithic app in version 1 and the same app in version 2. With a load balancer we can divert user traffic (can be subset or 100% traffic) coming from the users to version 2 of the apps.

As mentioned before, the drawback of this approach is that we can’t really perform a partial deploy of an app, we need to deploy the entire application stack and test it as a single monolith. This is one primary reason the industry decided to move to microservices. Microservices allows us to update each part of a business app independently from others due to their loosely coupled architecture.
In the image shown below service, A communicates with service B. Service B is built from 3 pods. By default, K8S will split the traffic between all 3 Pod’s equally so each Pod will get 33% of traffic.

Let’s assume we need to update the code in service B, we want to create other versions of this microservice (we’ll call it v2) and steer the traffic between the two microservices in a “canary upgrade” * fashion.
*Canary process upgrade – canary refers to a process when a whole lot of servers\services are going to be upgraded and you want to check the upgrade and code are solid. In that process, we will first try to upgrade a small number of servers\services (usually 1), the “canary”, and only if that is successful will the remaining’s. The origin of the term “canary” in the Link.)
Following the image is shown below, service A communicates with service B, we would like to steer the traffic to the new version of microservice B but we don’t want to steer 25% of all traffic. We want to use the canary upgrade and test it first with a small portion of the traffic (let’s say 1%) and even control who is the exact user that hit our v2 by L7 parameters like username, browser type, and other L7 attributes.
With K8s we can’t achieve this goal.

Steering traffic in L7
Due to the basic fact that all the traffic passes through the proxy, that has the ability to control traffic on layer 7 (Application layer), we can steer the traffic based on L7 attributes and separate it between microservices as we pleased.
For example, we can steer a percent of the overall based on the user identity or event browser type.

What about security?
Another key aspect that needs to be addressed when we move from the monolithic to the microservice is security and confidentiality.
As shown in the image below, in the monolithic world we didn’t need to take care of encrypting traffic passing between different process on the same server, when we move to the microservice world this traffic is now passing over the wire, this can expose us to a “man in the middle attack”.

The network between microservices in a k8s based container orchestration is by default not encrypted nor firewalled, controlled or managed in any way.
We will address the challenge of connecting the microservices and manage the underlay networking and security in other blog posts describing the VMware offering around network and security.
In Service mesh perspective, we can address the challenge mentioned above on L7 with the encryption on the traffic between microservices.
Back to the problem in the traditional infrastructure, to solve it we had to insert a digital certificate to each application and maybe change the way the application communicates with other applications, that also demanded us to update the certificates and manage them along the time.
The abstraction of that problem with Service mesh allows us yet again to solve the problem centrally with the Service mesh infrastructure without affecting the code and without any relevance to the language or purpose of the microservice.
There is a component in the SM control plane called Certs that allows us to issue certificates to each proxy on the mesh. Encrypting the traffic between proxy’s allows us to solve the problem in the infrastructure level and not worry about the change of code or the basic container image of the microservice. As mentioned before the entire traffic of the Pod is directed through the proxy, so we ensure that the entire traffic is encrypted and secured.
The management is centralized and in infrastructure perspective so it won’t affect the code or the behavior of the application in any way, and that’s the key point: abstraction.

Application insight and user experience
Tracing is our ability to understand and visualize how a single transaction span between different components in our application with a timeline graph. We use the tracing ability to find bottlenecks and performance issues between the microservices inside our application.
Transaction tracing on monolithic architecture was very easy compared to tracing distribute system such as microservices. in distributed services a single user request can translate to a series of RestAPI Calles between different microservices, this is where the real challenge begins, because of the relationship between the different microservices and the complexity of the bonds between them we don’t really know where the transaction starts and where it ends.
This is an example of tracing one request translated to five different API calls between different microservices. The trace shows a set of spans and describes the different microservices involved in the request by the request tag and with a corresponding timeline.
As you can see the begin of the request, for example, was microservice A which triggered action on microservice B etc. on the example, microservice E start only after B and D finish.
For each span we can see the start point with time and end point with time, with this info we can understand the latency per span. With that info, we can troubleshoot the chock point.

Now try to do trace transactions in applications built from thousands of microservices?
The images below illustrate the complexity of the relations between microservice in Amazon and Netflix. as you can imagine tracing transactions in this environment can describe as mission impossible.

To help us to monitor the transactions and get the tracing info we need there are some tools called client libraries. The installation of those libraries was according to the language the code is written in.
Most of the time when developing Monolithic applications, we use a single language so installing the right library isn’t an issue and it’s relatively easy. When we move to microservices architecture and with that diversity of development languages we need different libraries for different microservices with different data formats witch lead to polyglot microservice.
More on the challenge of tracing polyglot services is described in the solutions that address the challenge, for example, a very known tool is Jaeger:
https://www.jaegertracing.io/docs/1.8/client-libraries/
There is a list of the supported libraries by the language of code:
https://www.jaegertracing.io/docs/1.8/client-features
the table shows that each client libraries provide different capability and feature sets that depend on the language of code we are using.
Let’s take for example application built from two microservice developed in NodeJS and Python, to be able to get any tracing info we need to install Jager for NodeJS and Jager for Python on each microservice, after that effort, we may still get inconsistence tracing data results.

Again, the ultimate answer is an abstraction and the use of Service mesh data plane and control plane as the surface to do so. Once we use the proxy as the tracing point for all the traffic going in and out of the POD we can be abstracted to the code of the microservice running on the container alongside the proxy. The trace is being achieved on the infrastructure level for all the microservices that take part in the mesh without the bother of addressing different runtimes, different languages, and diversity of tool

Summary
In this blog, we tried to illustrate what Service mesh is and explain what value it brings.
There are a lot of benefits in moving to microservices architecture but with that, there are a lot of new challenges. Most of the challenges can be overcome in traditional infrastructure but that won’t stand the test of scale that is required with the proliferation of services deployed on the network.
The solution is an abstraction, abstracting the infrastructure of microservices and delegating the hard work to dedicated components that will be responsible for everything that can be addressed commonly and centrally and decoupling the business logic and core functionality of the microservice to do just what he was supposed to do and nothing else.
In Part 2 we will address the technologies around the SM and VMware offering around it.
Special thanks to Niran Even-Chen, Oded Shopen and Kobi Shamama for the support, comments, and reviews.

One thought on “The Service mesh Mystery – Part 1”